Financial Dashboard
AI-assisted financial data analysis tool
Project Overview
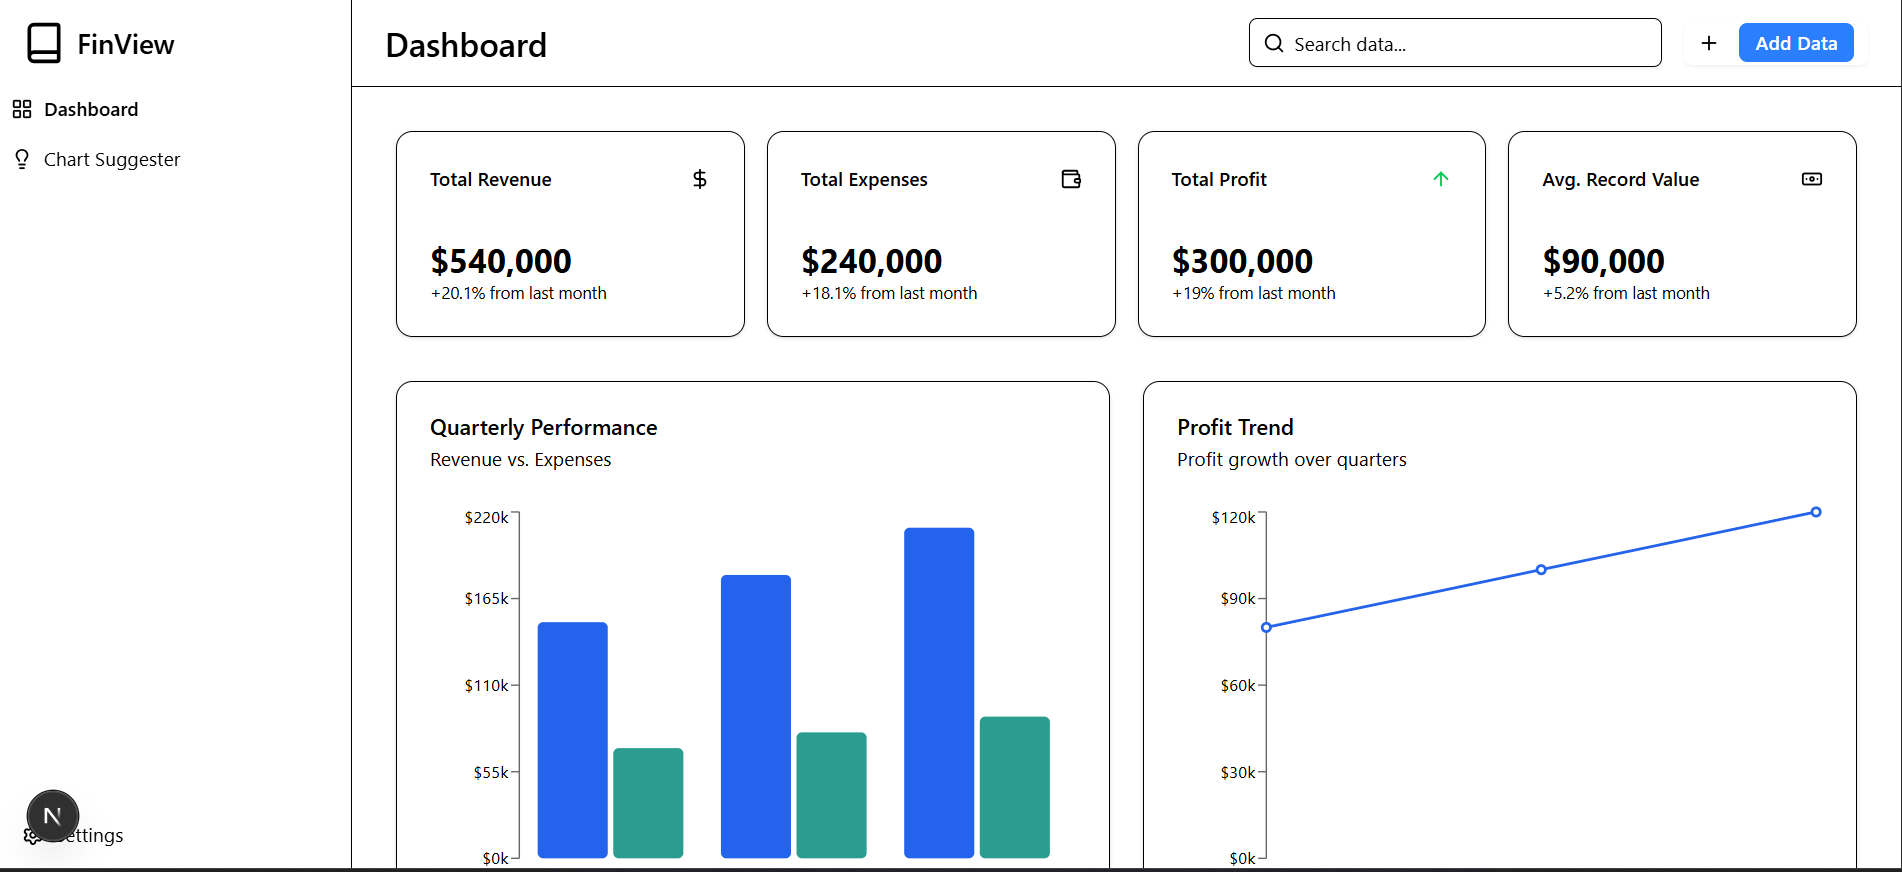
A comprehensive financial data analysis dashboard with AI-assisted interactive chart generation, full data management capabilities, and summary statistics for informed decision-making.
Problem Solved
Financial data analysis requires complex tools with steep learning curves. This dashboard provides intuitive visualizations with AI-powered chart generation to make financial insights accessible.
Architecture
Built with Next.js and TypeScript, the dashboard uses a component-based architecture with reusable chart components. AI integration enables natural language query processing for dynamic chart generation.
Key Features
- Interactive bar, line, and pie charts
- AI-assisted chart generation from text prompts
- Full CRUD data management
- Summary statistics and trends
- Export capabilities
- Responsive dashboard layout
Performance & Optimization
Optimized with server-side data fetching, memoized chart components, and efficient state management with Zustand. Charts render smoothly even with large datasets.